WHERE IS THE HOUSING MARKET STRONGEST?
November 23, 2022
It's no secret that the housing market has not been skyrocketing in 2022 the way it did in 2021, but it may surprise some to know that there are some markets in the US that actually do have a higher sales rate than 2021, and several have a higher rate than 2019, the last pre-pandemic year that we can consider "normal," and which was considered a healthy year for the housing market.
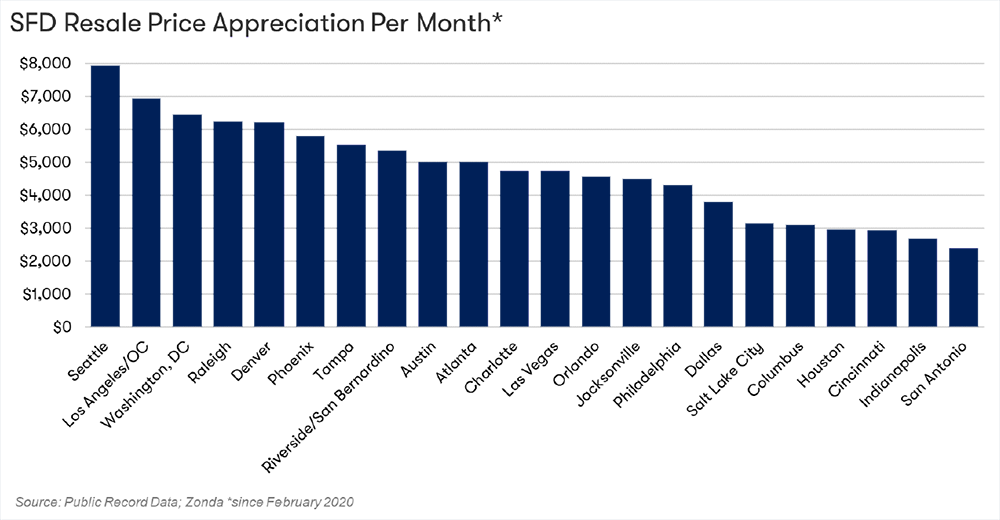
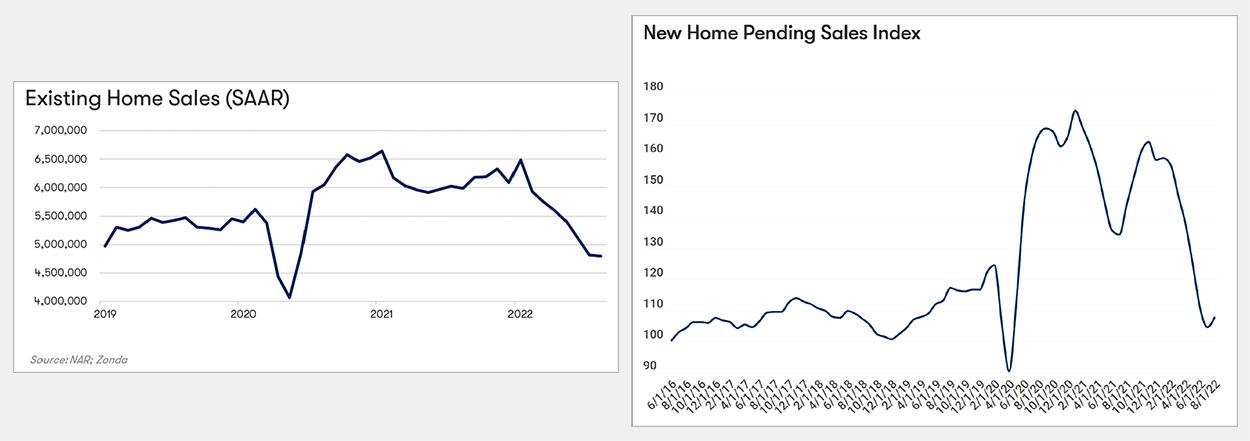
In the years since then, resale home prices have been going up between $2,000 and $8,000 every month in the major markets. Nevertheless, despite these rising costs, the national level of pending sales is only slightly below what it was in 2019.
Zonda Cheif Economist Ali Wolf presented localized data for markets across the country in a recent webinar. The average sales rate compared to 2019 is lower in some regions and higher in others. The same goes for year-over-year average sales rates.
For example, the average sales rate in Miami in 2019 was just under 2% and now it’s over 3%. However, at the other end, the rate in Phoenix is currently under 1.5% compared to being over 3% in 2019.
How we judge the health of the building industry right now “depends on the specific market within the region, the housing product, what that market has been through, and which buyer group you’re selling to,” Wolf said.
THE SOUTHEAST REGION
Perhaps the strongest region in the country is the Southeast. This region includes Atlanta, Charleston, Charlotte, Jacksonville, Louisville, Miami, Nashville, Orlando, Raleigh, Richmond, and Tampa. Since 2019, the majority (9 out of 11 cities) have had increased sales rates, with as much as 122% in Miami, 81% in Jacksonville, 51% in Tampa, 41% in both Atlanta and Charleston.
However, year-over-year, all but Miami have experienced drops in their sales rates. This may be the beginning of a gradual return to the normalcy of 2019.
Migration, lifestyle changes, and diversified employment opportunities are helping support some of the growth in the Southeast. Wolf added, “This market has held up a lot better than most other markets and is outperforming compared to history.”
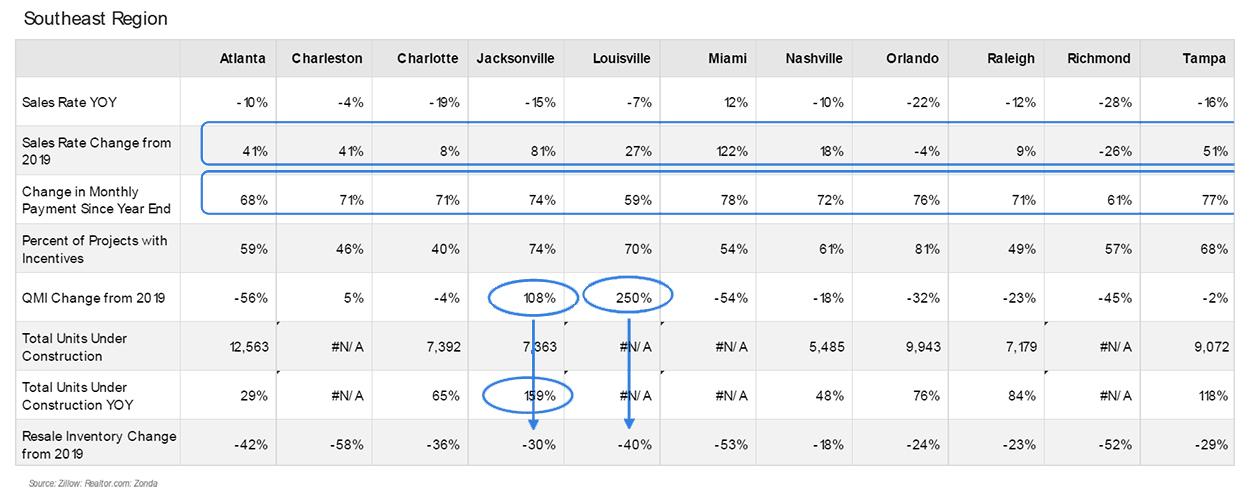
Note the change in monthly payments since year end. (The data is based on a 6% interest rate, not 7%.) In Miami, it’s 78% higher! But those huge increases in monthly payments have “not translated into dramatically slower sales, at least at this point,” Wolf said.
THE MIDWEST REGION
The picture is more mixed in this area, which includes Chicago, Cincinnati, Columbus, Detroit, Indianapolis, and Minneapolis.
The Detroit market is one of the few markets in the country with increased sales rates both since 2019 and 2021. Detroit is up 9% since last year and 4% over the last three years. Chicago and Cincinnati have been relatively stable at -4% and 0% YOY respectively.
The biggest changes in this region since 2019 are in Chicago and Indianapolis, where average sales rates have increased by 42% in both locations.
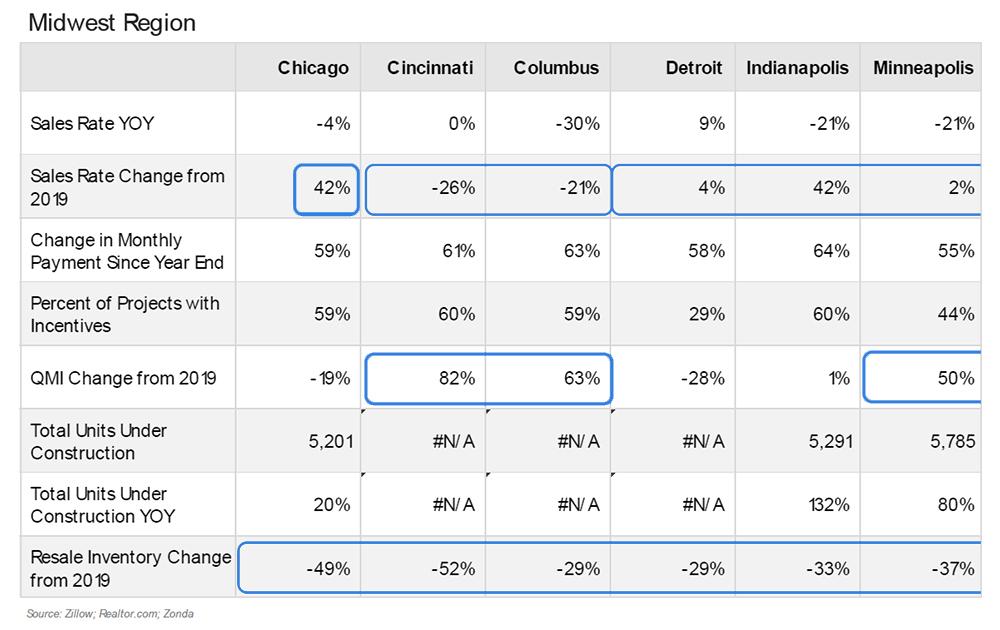
Wolf suggested that there’s significant migration from the Southeast to the Midwest. As the former becomes more expensive, the latter is affordable in comparison. As she put it, “Relative affordability is still important.”
THE PACIFIC REGION
This region includes Los Angeles/OC, Portland, Riverside/San Bernadino, Sacramento, San Diego, San Francisco, and Seattle. Every one of those markets has experienced drops in the average sales rate since last year; however, the comparison with 2019 is more mixed. San Diego's sales rate is up 82% since 2019, the second-highest improvement in the country. Los Angeles is up 27% and Portland is up 9% over the last three years.
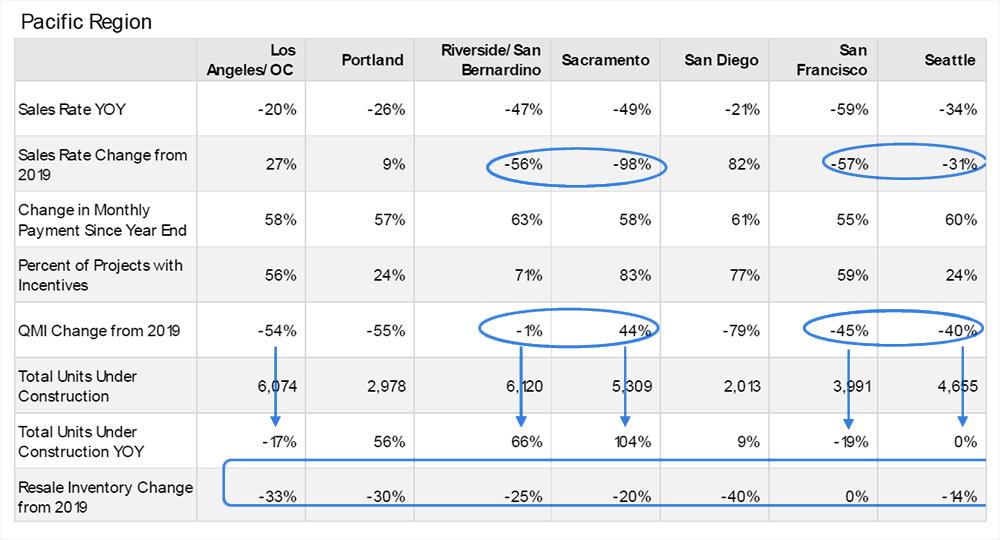
Wolf’s proposed explanation for the drop in Sacramento, for example, is that pre-pandemic it was a more affordable location (by Californian standards) and “when the pandemic hit, and more people worked from home, more people moved a little inland” pushing up local prices. People could get more bang for their buck in Sacramento than in, for instance, San Francisco. But as many people have returned to the office, prices have dropped again.
THE NORTHEAST REGION
Finally, in the northeast, the sales rates in New York, Washington DC, and Philadelphia are all down YOY, but Philadelphia is up 7% from 2019 and New York is even.
Wolf said that the Northeast is not as “boomy and busty” as some other markets. Because the cities are older and there’s so less land available to develop, there aren’t many units under construction. In addition, there are constraints on resale inventory, with homeowners not that willing to put their homes on the market. All this leads to a more stable market compared to other regions.
About this region, Dan Fulton, Zonda's Senior Vice President of Advisory, said, “There are incentives and price cuts to move product today, but also an expectation that price changes in the medium term aren't dramatic because of tight resale inventory.”
No matter how strong your local market may be, there is likely a Builders FirstSource location near you to help with your next building project. Our experts can help you weather any turns in the market and be keep you well-positioned for projects in the future.