MIGRATION MANIA: HOW WORK FROM HOME HAS TURNED THE MARKET ON ITS HEAD
June 15, 2021
In our most recent blog post, we took a look at current housing industry trends, including surprising spikes in new home prices across all price ranges. New home sales continue to flourish — even in areas hit hard by unemployment. What are the factors playing into these trends?
Move-up buyers — not first-time homebuyers — are dominating the market today. And it makes sense. Tethers to the office have been loosened for many, making certain buyers well-positioned to drive up prices.
MIGRATION MANIA IS REAL
Suddenly, a large percentage of people can work from almost anywhere. As a result, home prices in a new market that feel steep to locals may seem incredibly reasonable for some out of towners looking to relocate. For certain markets, like Austin, Phoenix, Las Vegas, Raleigh, Tampa, and Jacksonville, this has been a game changer.
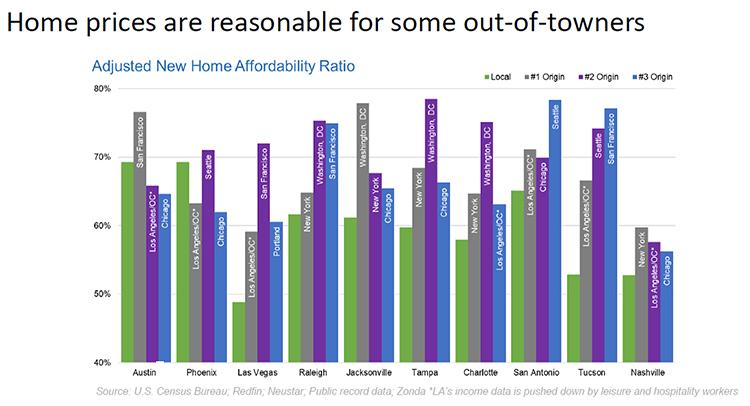
In the chart above, you can see that about 48 percent of households in Las Vegas can afford a median-price new home. Someone from San Francisco, for example, who moves to Las Vegas can afford a much higher price and is going to show very little sticker shock. For that buyer, it still feels like a deal. All of a sudden, a home price can go up $100,000 to $300,000, which is great for builders and the move-up space, but will likely later prove difficult for local buyers.
And according to Redfin, the top three markets searching for homes in Las Vegas are San Francisco, Portland, and Los Angeles/Orange County. If you take San Francisco’s income distribution and put it in the Las Vegas market, now 72 percent of households can comfortably afford a median-price new home (and then some).
A staggering seven million people are looking to buy a home over the next six to 12 months. Just over one million of those buyers are looking specifically at the new home market. So, where are they buying? Most recently, the largest share of single-family permits is in cities like Houston, Dallas, Atlanta, Cleveland, Jacksonville, and Tampa:
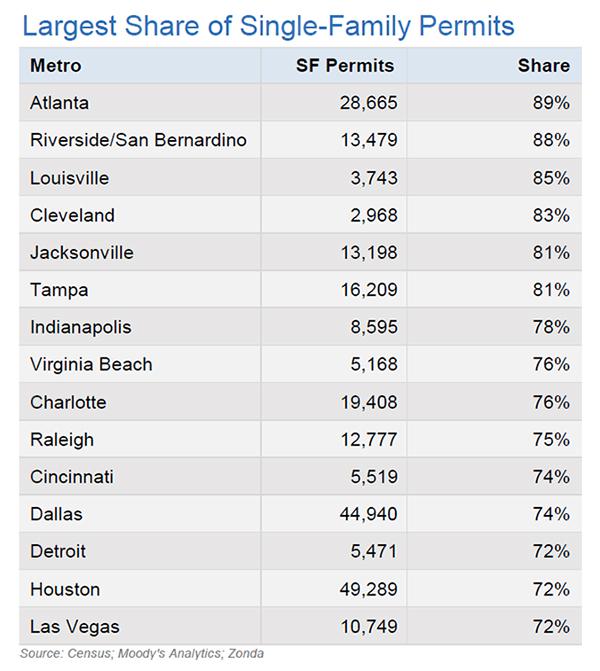
Not surprisingly, the smallest share of single-family permits can be found in large, land-constrained metro areas, such as New York City, San Diego, San Jose, San Francisco, Los Angeles, Denver, and Miami. Make no mistake, there is still a lot of money to be made in these markets, but product has had to shift to account for these constraints.
In some areas, people don’t even have to move out of state to find a better deal. Seventy percent of the best-selling homes are more than 30 miles from downtown. People have shown that they’re willing to move farther away from the central business district, where builders can generally find more land and adjust for affordability.
THE MOVE-UP MARKET IS WELL-POSITIONED TO DRIVE GROWTH, BUT DON’T COUNT OUT MILLENNIALS JUST YET
Job growth is improving in many sectors, but it’s still not where we’d like it to be. While unemployment numbers are improving, it’s been a tough year for many financially. So, how can so many people afford to buy in the current market?
Since move-up buyers are predominant in the market right now, many of them fall on the right side of the K-shaped recovery the economy has experienced over the past year. They have several key advantages that most would-be first-time homebuyers simply don’t have yet:
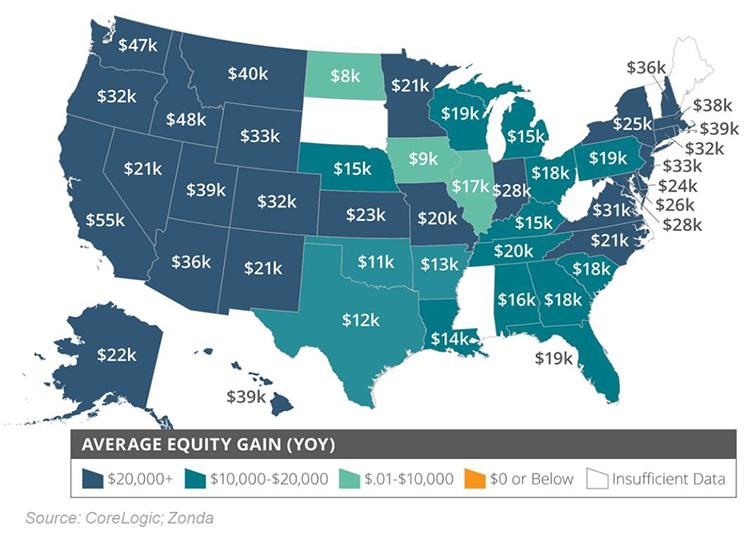
- Home equity gains: Whether through longevity, smart refinancing, or both, average equity gains are up for current homeowners. For Californian homeowners, that average is $55,000 year over year. So, if you live in California and you're moving to Phoenix, Jacksonville, or Austin, you have a lot of money to bring into that market.
- Stock market gains: Roughly half of Americans have money in stocks. While the stock market initially took a hit early on during the pandemic, many sectors have rebounded. Those homeowners who can liquidate some of their stock options can put that money toward a down payment.
- Record personal savings: We have now had over a year of record-level savings. Sixty percent of millennials saved more money in 2020 than in 2019. While 54 percent of them want to keep on saving, 43 percent want to use those savings for a down payment on a home. It’s vital for builders to keep millennials in mind as they move closer to the possibility of home ownership.
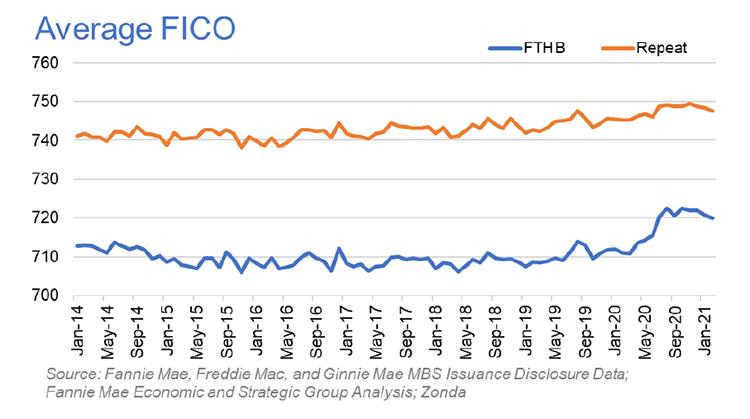
- Great buyer quality: Average FICO scores are higher than they’ve been in years. And, for the first time since before the pandemic, they’ve increased for first-time buyers. The average back-end debt-to-income ratio is increasing. As home prices go up, some buyers will have to take on a higher mortgage, but for now, these numbers are very healthy.
A lot of millennials are still sitting on the sidelines for various reasons. Some just aren’t quite ready and some don’t have the funds yet to make a down payment, while others complain that prices are too high or there’s no inventory right now. But, millennials, the largest living generation, are the reason we’re so optimistic about the future of the housing industry, so keep an eye out for increased activity from these buyers over the next several years.
WATCH AFFORDABILITY AS INTEREST RATES GO UP
Home builders are currently reaping the benefits of the move-up market and corresponding migration mania, but it will be important to keep tabs on future changes to the interest rate and its corresponding impact on affordability.
Each time the interest rate goes up, a percentage of potential households will be priced out of the market. Here’s how a 3.5% interest rate, which is expected by the end of 2021, will impact several key markets:
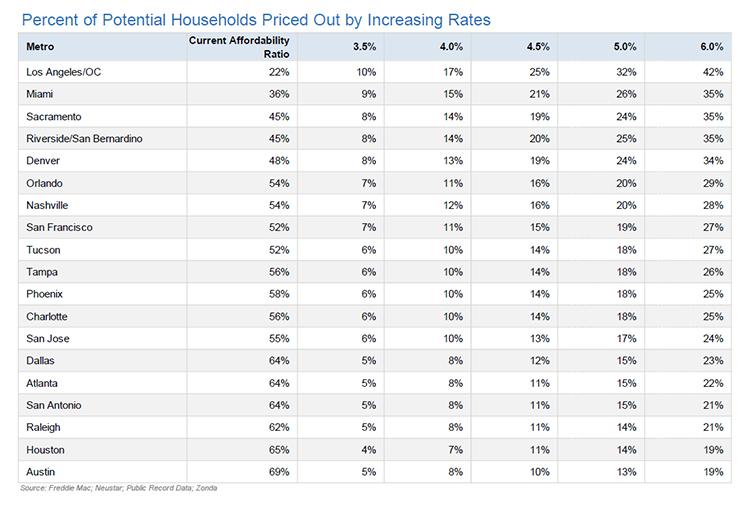
At the top of the list, if interest rates in Los Angeles go from where they are today to 3.5 percent, 10 percent of potential households will be priced out. In Austin, 5 percent of potential households will be priced out. You’ll lose some buyers, but chief economist Ali Wolf doesn’t think 3.5 is the number that will break the camel’s back.
However, you can’t look at interest rates in a vacuum. You have to also take price appreciation into account. When the rate goes up, home prices will, too. So, what does that look like? Take a look at the following table:
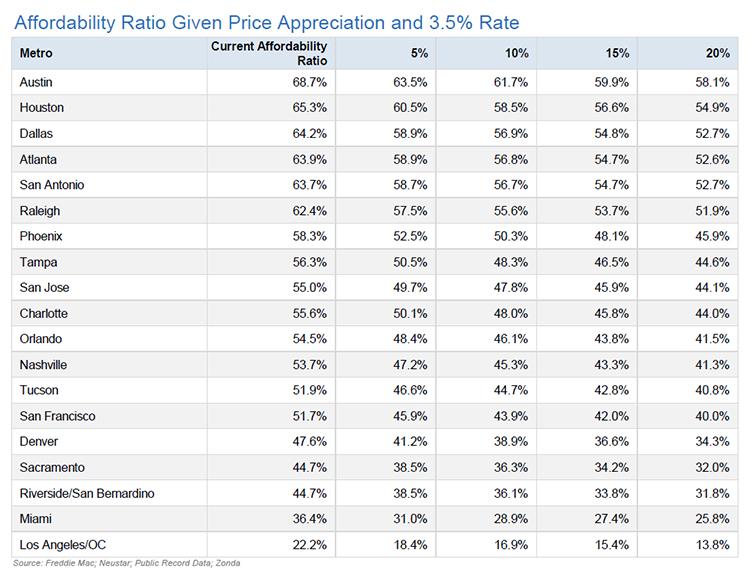
Currently, 68.7 percent of the Austin market can afford the median-price new home. Once the interest rate goes up to 3.5 percent, however, what happens if home prices go up between 5 to 20 percent? If home prices appreciate 5 percent, the percentage of households that can afford a median-price new home goes down to 63 percent. If the market can raise prices by 20 percent, the number drops even further to 58.1 percent.
As you can see, it’s a compound effect. The higher the interest rate, the more potential households can no longer afford a new home. It’s important for builders to watch both interest rates and home price appreciation, because at some point they will begin to impact the unexpected level of growth we’ve been enjoying.
If affordability does begin to slow down the market, builders may need to shift focus to different products for potential buyers. While it won’t happen overnight, and it will take a collaborative effort with architects, land planners, and city officials, there are steps builders can take to adapt. Ultimately, what builders know is that more starts = better affordability = better sales. So, look for markets where you can buy more land or replenish the lots that you have and continue to build.
Sign up below to be notified of our next Market Intelligence Webinar.